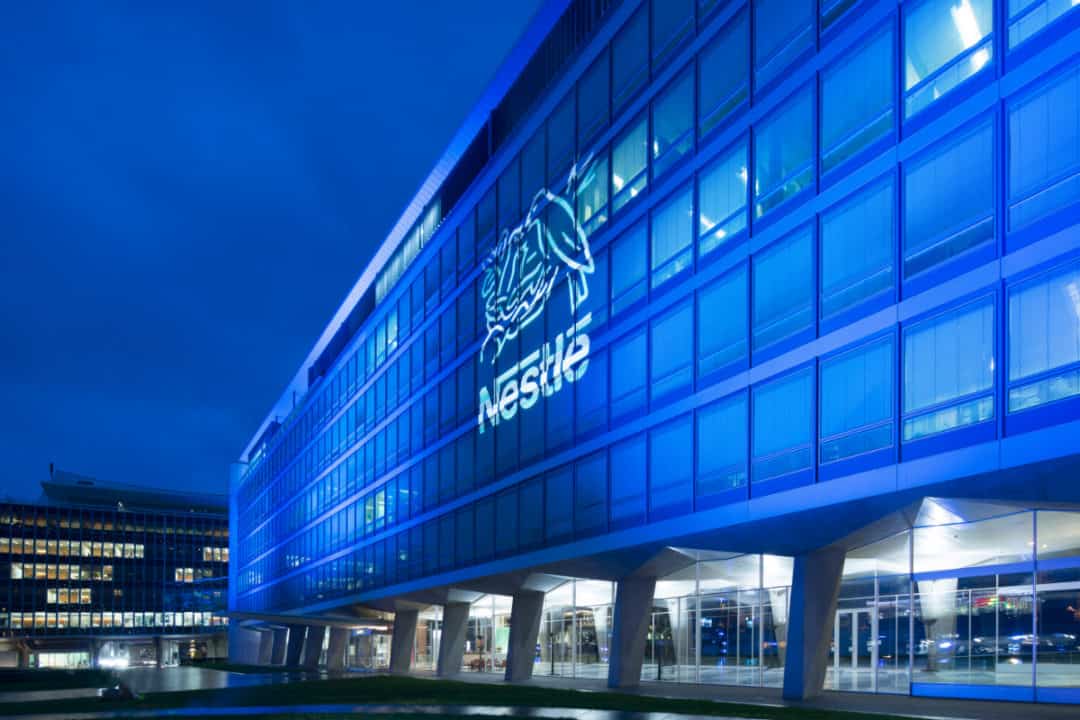
Nestlé S.A. is a Swiss multinational food and beverage company headquartered in Vevey, Vaud, Switzerland. It is the largest food company in the world by sales and other metrics as of 2014. It ranked 64th in the 2017 Fortune Global 500 list and 33rd in the 2016 Forbes Global 2000 list of largest publicly traded companies.

Let us look into the Overview of Nestle and then we can move on to the BCG Matrix of Nestle.
Overview of Nestle
Nestlé’s products include baby food, medical foods, bottled water, breakfast cereals, coffee and tea, confectionery, dairy, ice cream, frozen foods, pet food, and snacks. Twenty-nine of Nestlé’s brands have annual sales of over CHF1 billion (about US$1.1 billion), including Nespresso, Nescafé, Kit Kat, Smarties, Nesquik, Stouffer’s, Vittel and Maggi. Nestlé owns 447 factories, operates in 189 countries and employs about 339,000 people. Nestlé is one of the major shareholders of L’Oreal, the world’s largest cosmetics company.
Nestlé was formed in 1905 from the merger of the “Anglo-Swiss Milk Company”, founded in 1866 by brothers George and Charles Page, and the “Farine Lactée Henri Nestlé”, founded in 1867 by Henri Nestlé. The company grew significantly during World War I and after World War II, expanding its offerings beyond its early condensed milk and infant formula products. The company made a number of acquisitions, including Crosse & Blackwell in 1950, Findus in 1963, Libby’s in 1971, Rowntree Mackintosh in 1988, Klim in 1998, and Gerber in 2007.
The company has been associated with various controversies. It has been criticised and boycotted for marketing baby formula as an alternative to breastfeeding in developing countries (where clean water can be scarce), using child labour in cocoa production, and manufacturing and advertising bottled water.
What is BCG Matrix?
BCG growth-share matrix classifies different business units or products into 4 different categories like Dogs, Stars, Cash Cows and Question Mark.
These classifications are based on the growth rate of the industry and the market share of the respective businesses which are relative to the largest competitor present, for that reason, BCG Matrix is also called as Growth-Share Matrix
Also, Read the SWOT Analysis of Nestle in a Simplified Way.
BCG Matrix of Nestle
BCG Matrix of Nestle contains the Dogs, Stars, Cash Cows, and the Question Mark. In this reading of the BCG Matrix of Nestle, we will analyse the company’s low growth products, products that attract sales, high growth products, and products that may attract sales or may become low growth products in future.
Dogs
Dogs are the products that were thought to have the potential to grow but were unable to work any magic due to slow market growth.
The failure to produce the expected results makes the product a source of loss for the company and causes the management to withdraw future investments in the company. With no significant return on investment expected from the product, future investments are seen as a waste of company resources that could instead be invested in a question mark or star category.
Nestle’s Milo was launched as a chocolate and malt powder for milk and water. However, the product did not have a significant impact on the business and is placed in the dog quadrant of Nestle’s BCG matrix.
Stars
The products or business units that have a high market share in a high-growth industry are the stars of the company. In Nestle’s case, Nestle’s mineral water and Nestle’s Nescafe coffee fall into the star quadrant of Nestle’s BCG matrix.
The growing trend towards healthier lifestyles and emerging markets has led the brand to invest heavily to differentiate itself from competitors in mature markets and increase brand awareness in emerging markets.
Cash Cows
Cash cows are those products that have a high market share in a low growth market. For Nestle, there is one product that is undoubtedly a cash cow and that is Nestle’s Maggi Noddles.
With a market share of 80-85%, Maggi Noddles has a very strong position in the market and has high customer loyalty.
The product requires very little investment to maintain its market share and fend off competition.
Question Mark
There are products that formulate a part of the industry that is still in the development stage, and yet the company has not been able to establish a significant position in this industry. Due to the small market share that the company has achieved, the future prospects for the product are uncertain and therefore investing in such areas is considered a risky decision.
With increasing competition and the growing need for consumers to consume healthy products, the Nestle brand needs to make significant investments in the dairy and nutrition sector in order to maintain and grow its market share.
Nestle’s chocolates and confectionery is another business unit that can be classified in the question mark quadrant of Nestle’s BCG matrix. The high competitive pressure and low market share of the product in the industry lead it to be placed in this quadrant.